Software for Data Analytics,
Business & Location Intelligence
Promote data-driven decisions at all levels in your organization. disy Cadenza, the data analytics software for Business & Location Intelligence, accelerates your digital transformation with powerful functionalities and offers all employees flexible access to all aspects of data analysis - from visual analysis to Artificial Intelligence and Machine Learning.
Gain far-reaching insights based on your data and beyond. Intelligent visualizations and customizable dashboards including automated reporting support you in this. The unique combination of Business and Location Intelligence provides you with the relevant insights in facts and figures, in combination with spatial dependency. That's why disy Cadenza is the No.1 data analytics software for the public sector.
Informed Decision-Making
Informed decisions are based on insights that are supported by reliable data. disy Cadenza helps you analyze your data using modern analysis methods and interactive data visualizations, so that you can close the gap between data and decision making with knowledge. disy Cadenza allows you to view your analyses from different perspectives, for measures and trends as well as spatial dependencies. Intuitive and clever analysis options and an impressive library of data visualization suggestions help you along the way. Stay on top of the facts, figures and trends that matter to you with interactive and customizable dashboards. So you can make informed decisions every time.
Data Analytics that Inspires Everyone
Data Discovery - Exploring data for New Insights
Flexibly analyze your data and combine it with other data you supply in the software. Gain valuable new insights that help you make fast, informed decisions.
Information Delivery – Organization-Wide Provision of Information
Analyze and filter data flexibly. Summarize your findings in automated, time- or event-driven reports. All employees receive exactly the analyses and reports that they need for their tasks.
Geo Analytics – Discover Spatial and Temporal Contexts
With Location Intelligence, you can visualize and analyze all your data in a smart way for a more comprehensive overview on the map. Automated animations impressively support your temporal-spatial analysis.
Artificial Intelligence and Machine Learning – Advanced Insights
Thanks to disy Cadenza, it is no longer just data scientists who benefit from methods related to Artificial Intelligence and Machine Learning. Benefit from the flexibility of AI-based methods in your analysis and optimize your insights.
Embedded Analytics – Extending Custom Applications and Web Portals
Enrich your familiar working environment, custom applications and web portals with the powerful functions of disy Cadenza, including GIS. Or use your application directly in disy Cadenza!
One Platform - Organization-Wide Use
Take advantage of a wide range of supported databases and spatial formats as well as comprehensive Lifecycle Management. Use the logging, monitoring and management of authorizations, which is fully designed to meet the requirements of large, security-conscious organizations. Software made in Germany!
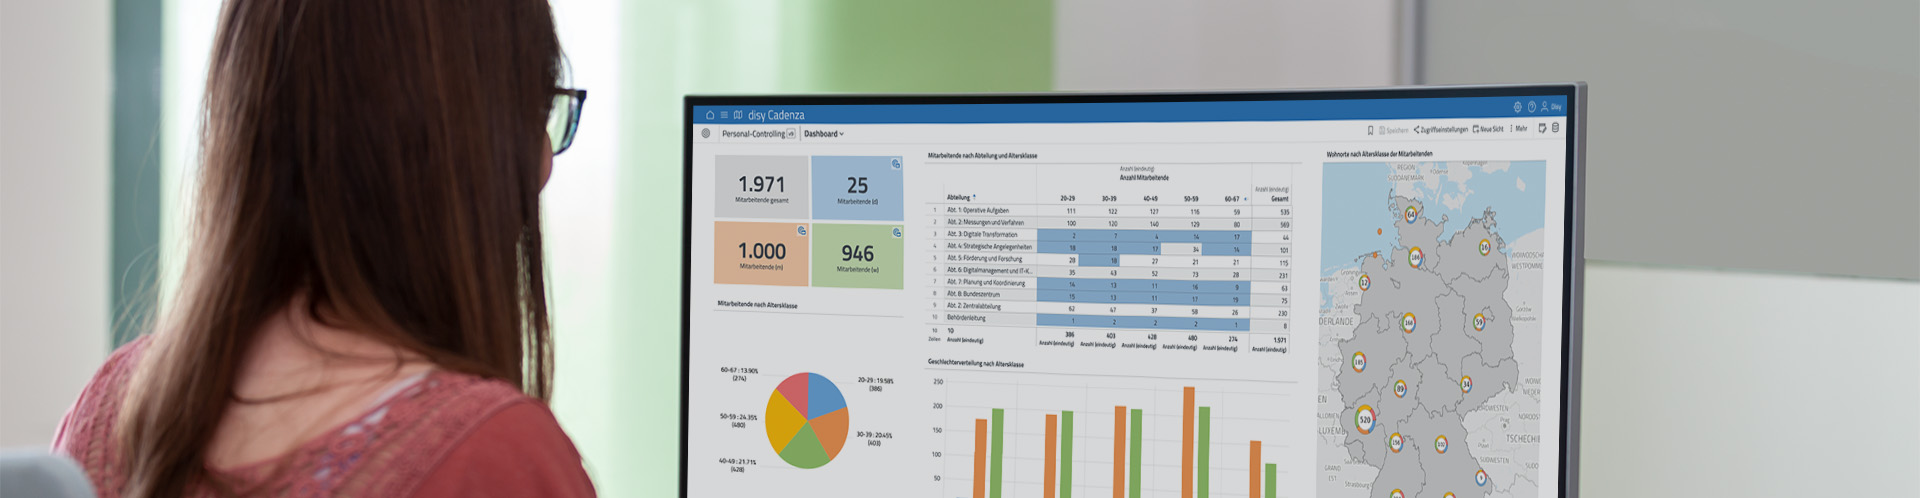
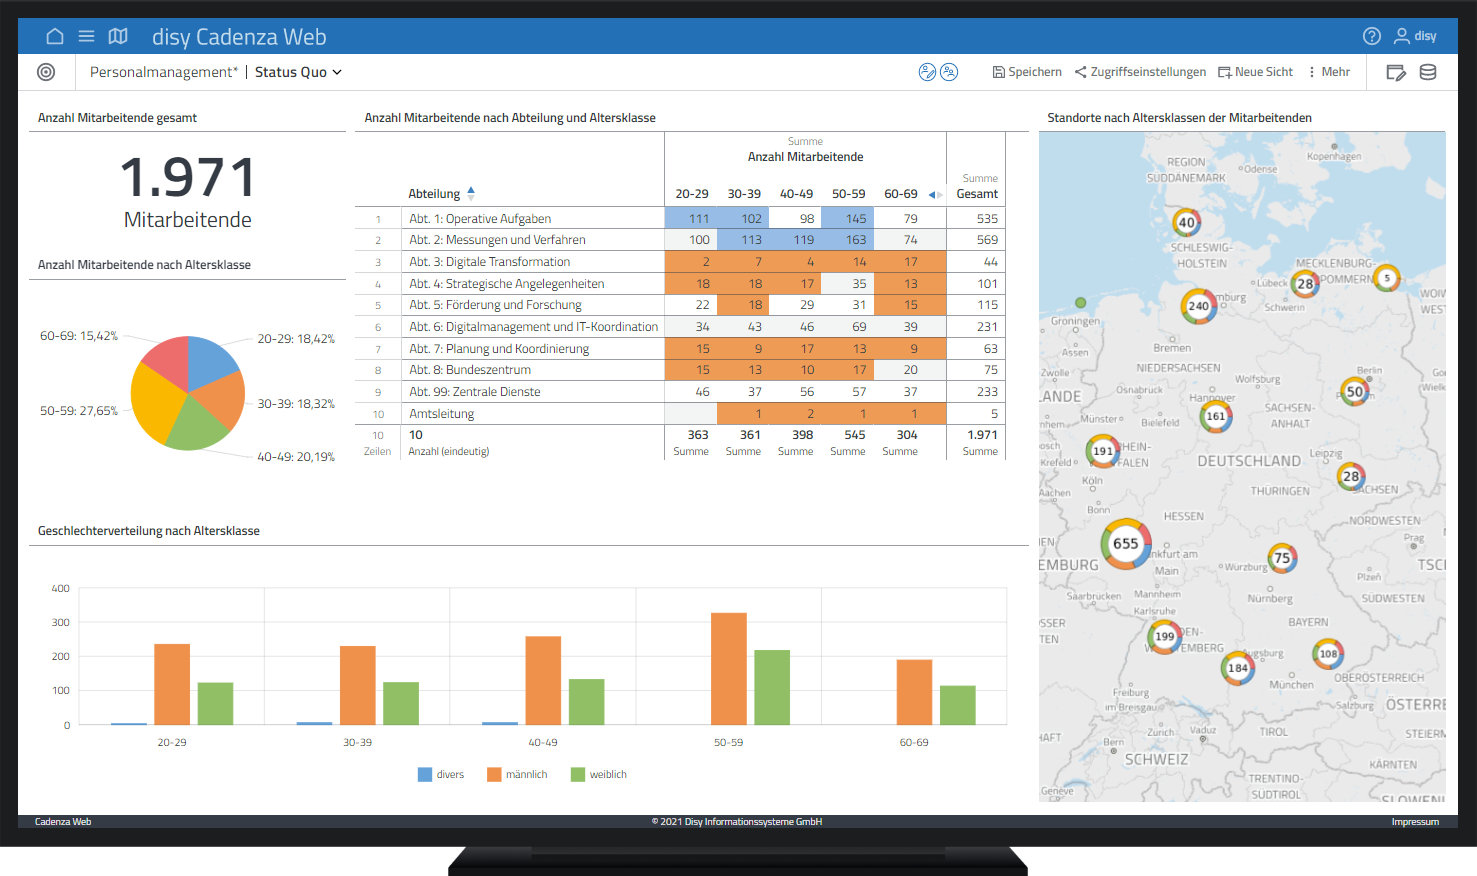
Interactive Dashboards for a Comprehensive Overview
Create your own individual and interactive dashboard in minutes: with tables, charts, maps, indicators or with images and texts. Filter for content relevant to you. All analyses and visualizations are automatically refreshed with the new query. Add new data to your analysis with intuitive drag-and-drop functionality and choose the type of your visualization with a single click. Use self-service to add data to the dashboard on an ad hoc basis. With this wide range of options, disy Cadenza ensures the comprehensive overview you need of your facts and figures.
One Data Analytics Software for Everyone in Your Organization

Empower everyone in your organization to work with data-driven information: From employees who work with information that has already been processed (Information Delivery) to power users who create and share new visualizations, reports, or dashboards on an ad hoc basis in your organization's corporate design, to analysts who collect and submit data and flexibly analyze it in self-service and along multiple dimensions to discover and understand correlations (Data Discovery).

„ disy Cadenza is the central tool for accessing our statewide data infrastructure. Meanwhile, more than 900 TLUBN employees and another 50 authorities are using the software. We also operate several expert portals which are available to the public. We were impressed by the open format and the option of being able to analyze both geodata and attribute data with one single software tool. Our users are very pleased with the operational simplicity of this system. Flexible configuration features facilitate system operation and allow fast response to new or changing requirements. ”
Denis Kalemba, Head of Information Technology, Digitization, Thuringian State Office for the Environment, Mining and Nature Conservation (TLUBN)
More for you and your analyses
Self-Service Data Discovery

Analysing data collaboratively
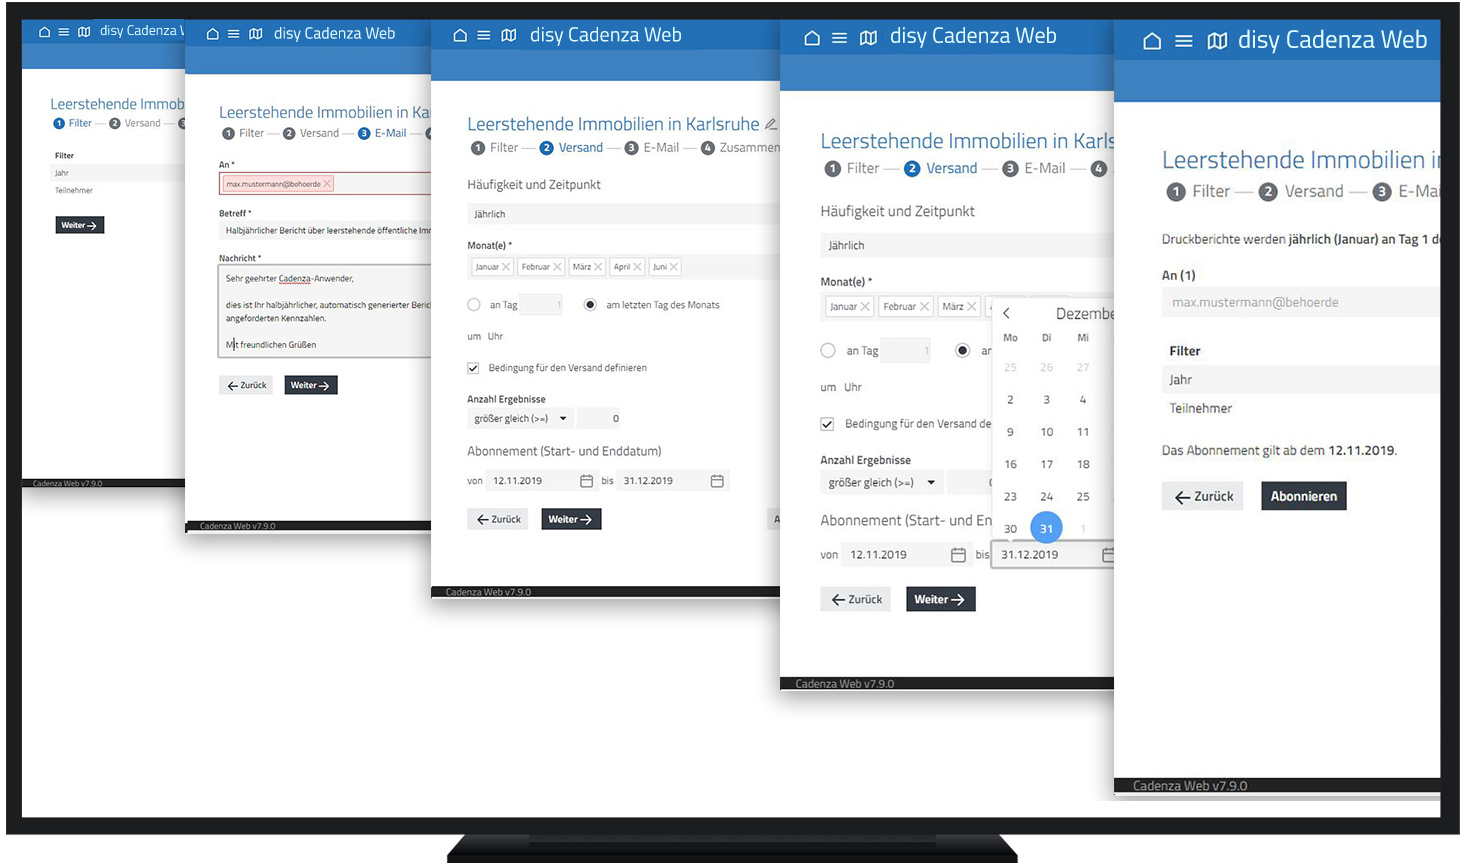
Create automated reports
Contact us


Interested in disy Cadenza?
We would be happy to introduce you to disy Cadenza in a personal meeting.