
Gaining New Insights and Understanding Correlations with Data Discovery
Next level data analysis: Disy Cadenza is designed to provide comprehensive support at every stage of your data discovery process. A variety of smart visualizations are available. They provide valuable insights by uncovering previously hidden peaks, hot spots, patterns, and trends. Furthermore, the integrated Advanced Analytics feature puts you a step ahead in tomorrow's analytical landscape. Address your information gaps with disy Cadenza and make well-informed decisions.
Data Discovery: Simply Discover More
Explore your data and discover the treasure trove of information hidden in your data with Data Discovery. Whether immediately visible or revealed upon further analysis, disy Cadenza provides valuable insights and helps you understand correlations. Trends and patterns can be quickly identified. Empower your data to speak for itself in the context of location and time. Our software opens an entirely new perspective on data by offering a broad array of technological capabilities.
Expressive Dashboards for a Comprehensive Overview
One of the highlights of disy Cadenza is the dashboards feature. It provides a comprehensive view of the status quo, current trends, and underlying patterns. These visualizations offer a comprehensive view of the data, presenting information in various formats such as tables, charts, maps, indicators, text, and image elements. For different hierarchy levels with ready-prepared results or interactively designed so that further analysis can be carried out.
Turn data into real-time, interactive visualizations with the Data Discovery tools in Disy Cadenza. Filters can be used to quickly focus on desired aspects and all visualizations in the dashboard can be updated - including spatial analyses.

Maximum Flexibility in Analyses
Enjoy maximum analytical freedom with disy Cadenza: experience the full range of available features without any rigid restrictions and obstructive process constraints. Switch between different visualizations on an ad hoc basis and visualize your data in tables, charts, and maps. Get to know the far-reaching effects for your work: There are no data-related or visual limitations.
Self-service: disy Cadenza unlocks the world of analytics
Use self-service for secure, data -compliant analyses. Analyze collaboratively by sharing your results with others. Add the latest data saved in XLSX, CSV, GPX or KML file formats to your analyses and benefit from up-to-date information. Integrate geodata and shapefiles, additional spatial databases such as Oracle Locator/Spatial or PostgreSQL/PostGIS and geodata services such as WMS, WFS into your analyses. Connect to ArcGIS Server via the REST interface to display additional layers in the background or to flexibly enrich your data. This allows you to reach new levels of analysis that you were previously unaware of. The entire process can be completed without involving a content manager or the IT department.


Advanced Analytics: Ready for Tomorrow's World
Lay the foundation today for future-proof data analysis and investment security: the implemented intelligence and Advanced Analytics from disy Cadenza make it possible. By using the latest technologies and implemented heuristics you benefit from
- a significant increase in analysis speed
- meaningful results with just a few mouse clicks - even for inexperienced users
- implemented analysis of the underlying data, content and structures as well as visualization recommendations
- instant update of analysis results as visualization changes with dynamic automatisms
Using Advanced Analytics and Machine Learning in disy Cadenza will further improve your analysis results. This is how you gain deeper insights: Decode unstructured data, identify hidden correlations, trends and patterns in your data and make predictions to solve complex problems, improve decision-making and discover new opportunities! Find your answers today with Diagnostic and Predictive Analytics methods.
Data Discovery in a Team: Collaboratively Analyzing Data
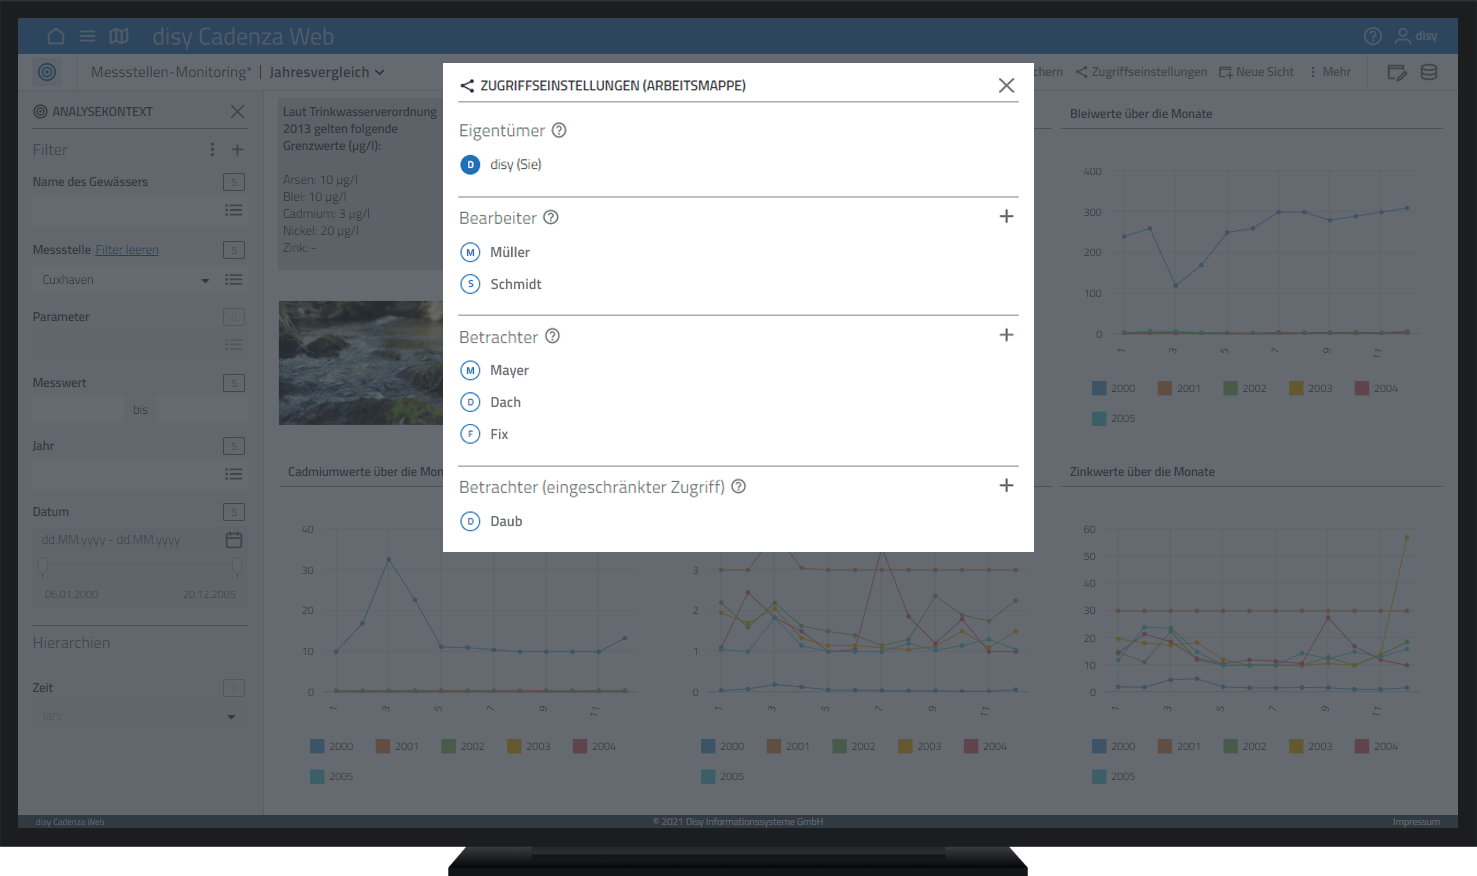
Data analysis does not have to be done alone, it can be a team effort. Share your individually created tables, visualizations, maps, or even entire dashboards with other team members or individuals. This allows your teams to find answers and to interactively analyze the data based on your preliminary work or data selection. disy Cadenza fosters collaboration and helps your team gain new insights that help the organization learn more. disy Cadenza supports data analysis in teams through a powerful permissions concept and intelligent features for collaborative work.
Contact us


Interested in disy Cadenza?
We would be happy to introduce you to disy Cadenza in a personal meeting.