
Discovering Spatial Contexts
with Geo Analytics
With disy Cadenza you can easily decode the spatial reference of your data. Location Intelligence is the key, bringing together two worlds that were previously thought of as separate: Business Intelligence and Geoinformation/Geo Analytics. Discover new perspectives in your data beyond spatial characteristics by integrating temporal dimensions into your geovisual analyses. Unique insights are waiting for you!
Integrating Spatial References into Analyses -
Your Gateway to Valuable Insights
Data contains valuable information. Sometimes the information is not immediately clear and understandable. You need connecting elements that help you understand the context. Space and time dimensions can achieve this. Geo Analytics methods help you to get to the bottom of things and include all spatial and temporal dimensions. By combining attribute and geospatial data, you have direct access to Location Intelligence and the valuable insights it provides.
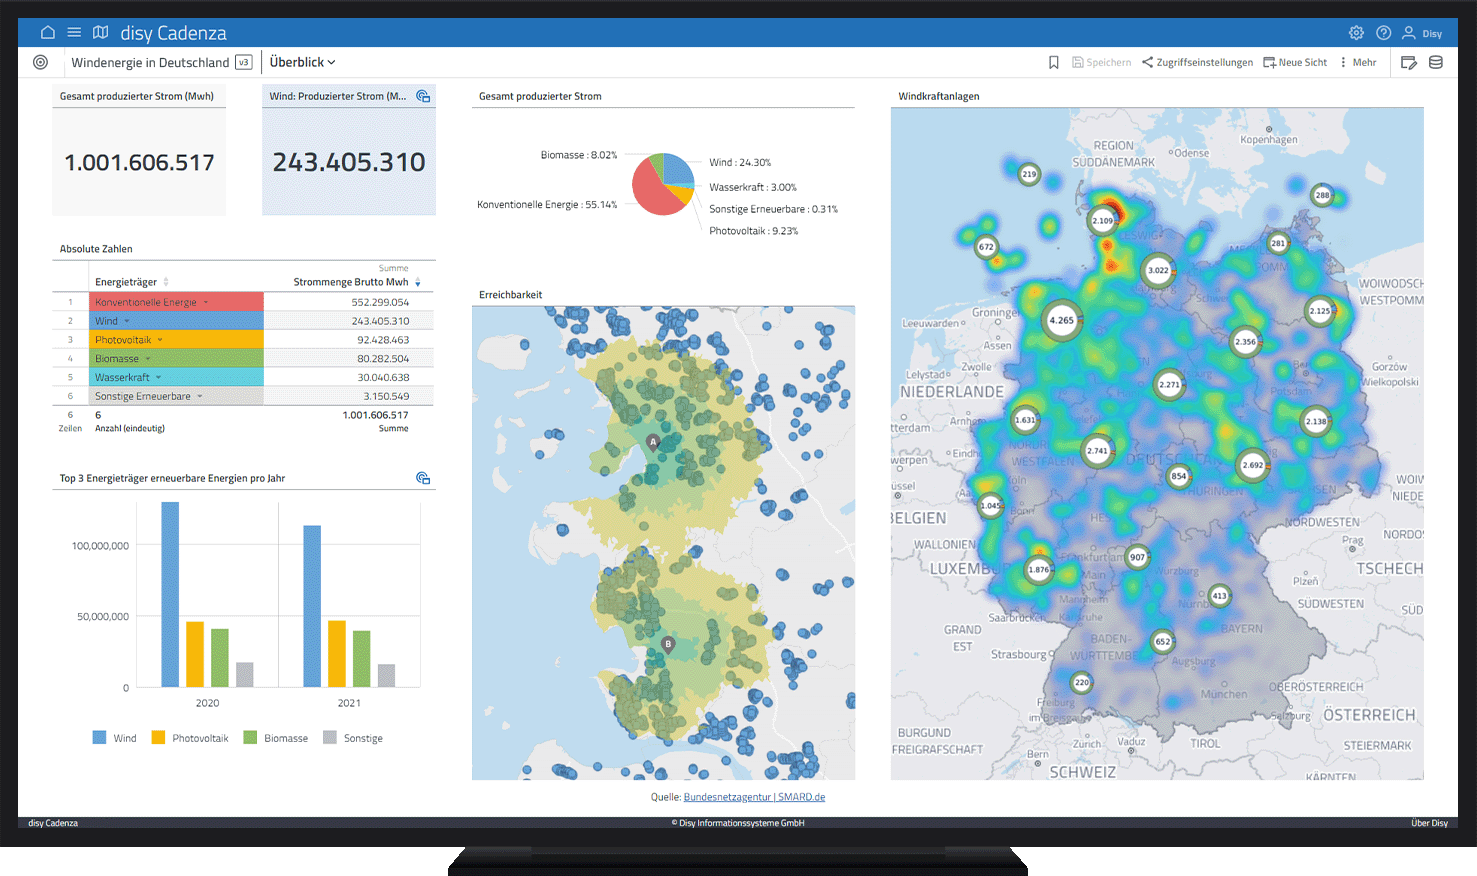
Visualize your data on a map: Complex correlations and dependencies in your data can be visualized in a meaningful and understandable way based on their geographic location. Location Intelligence will help you maintain a comprehensive overview. This provides you with a reliable information base for further decision-making.
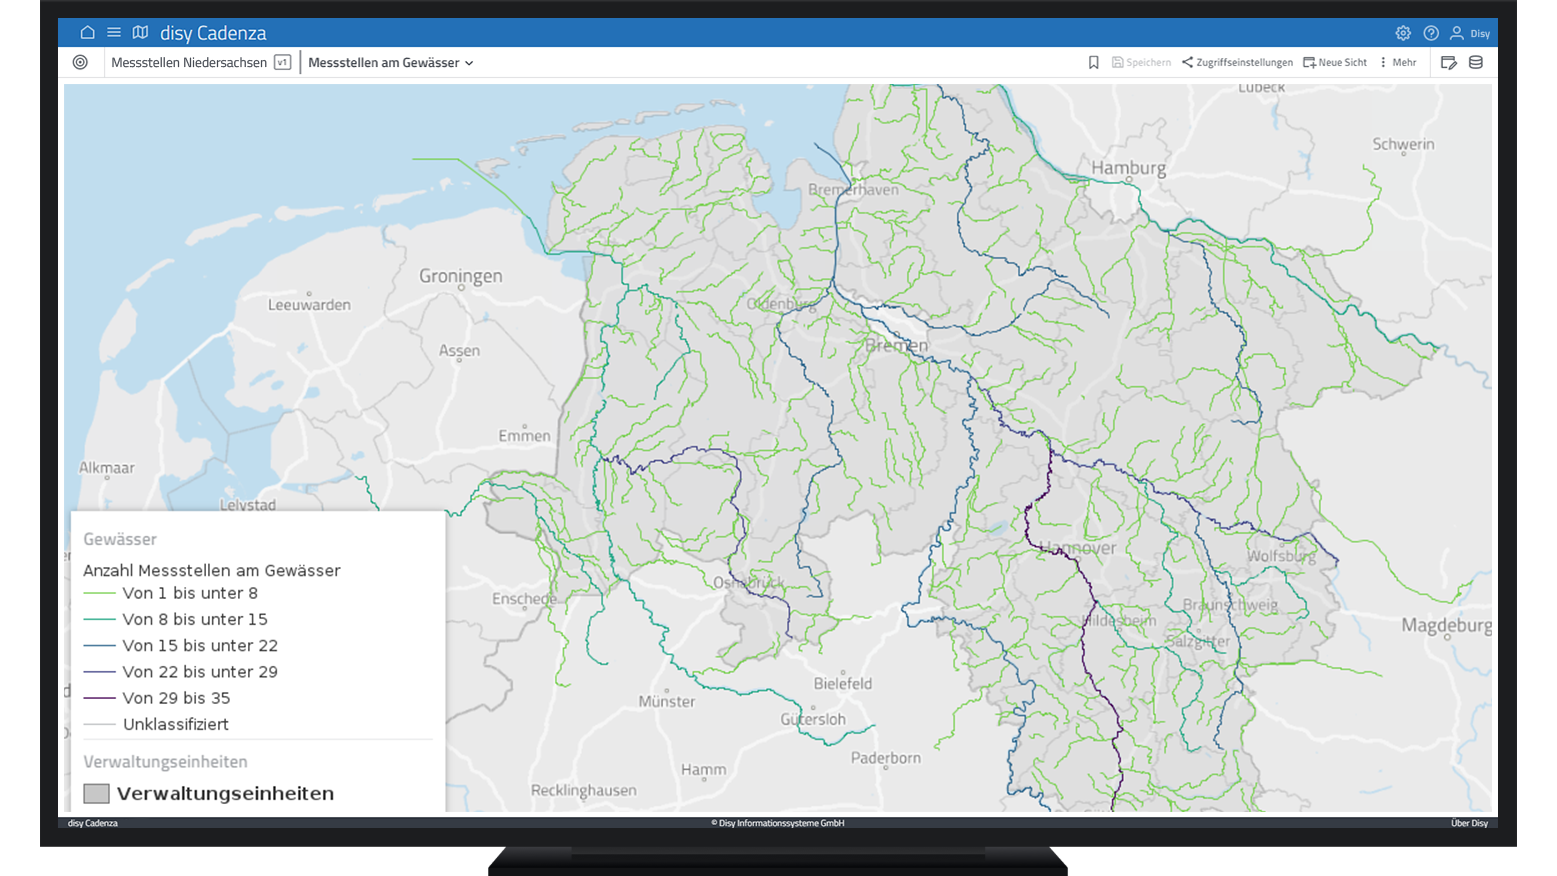
Visualizing and Exploring Data on the Map
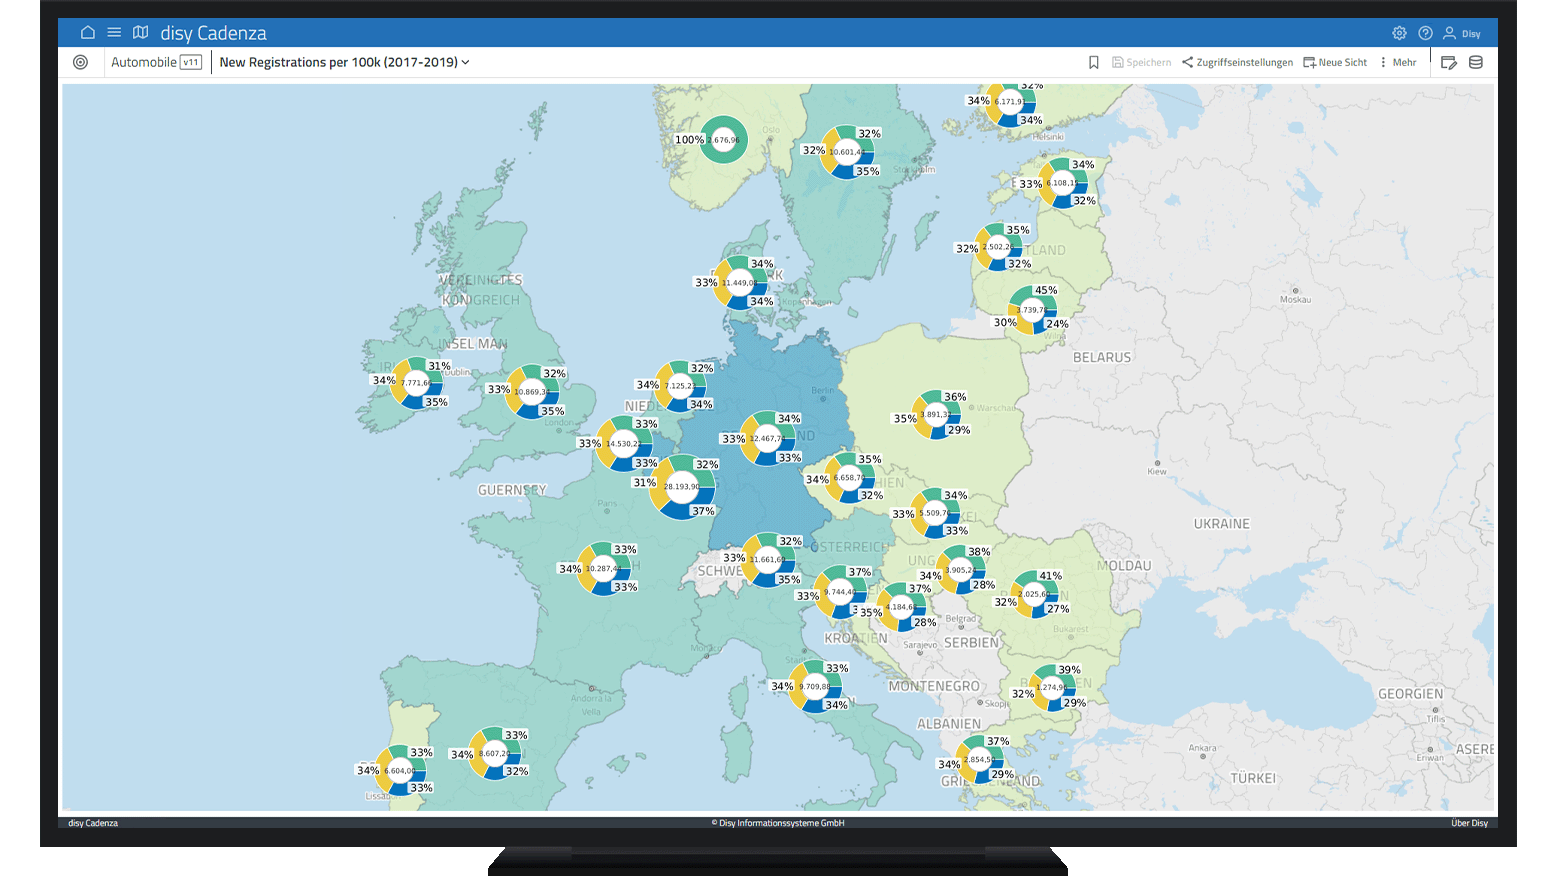
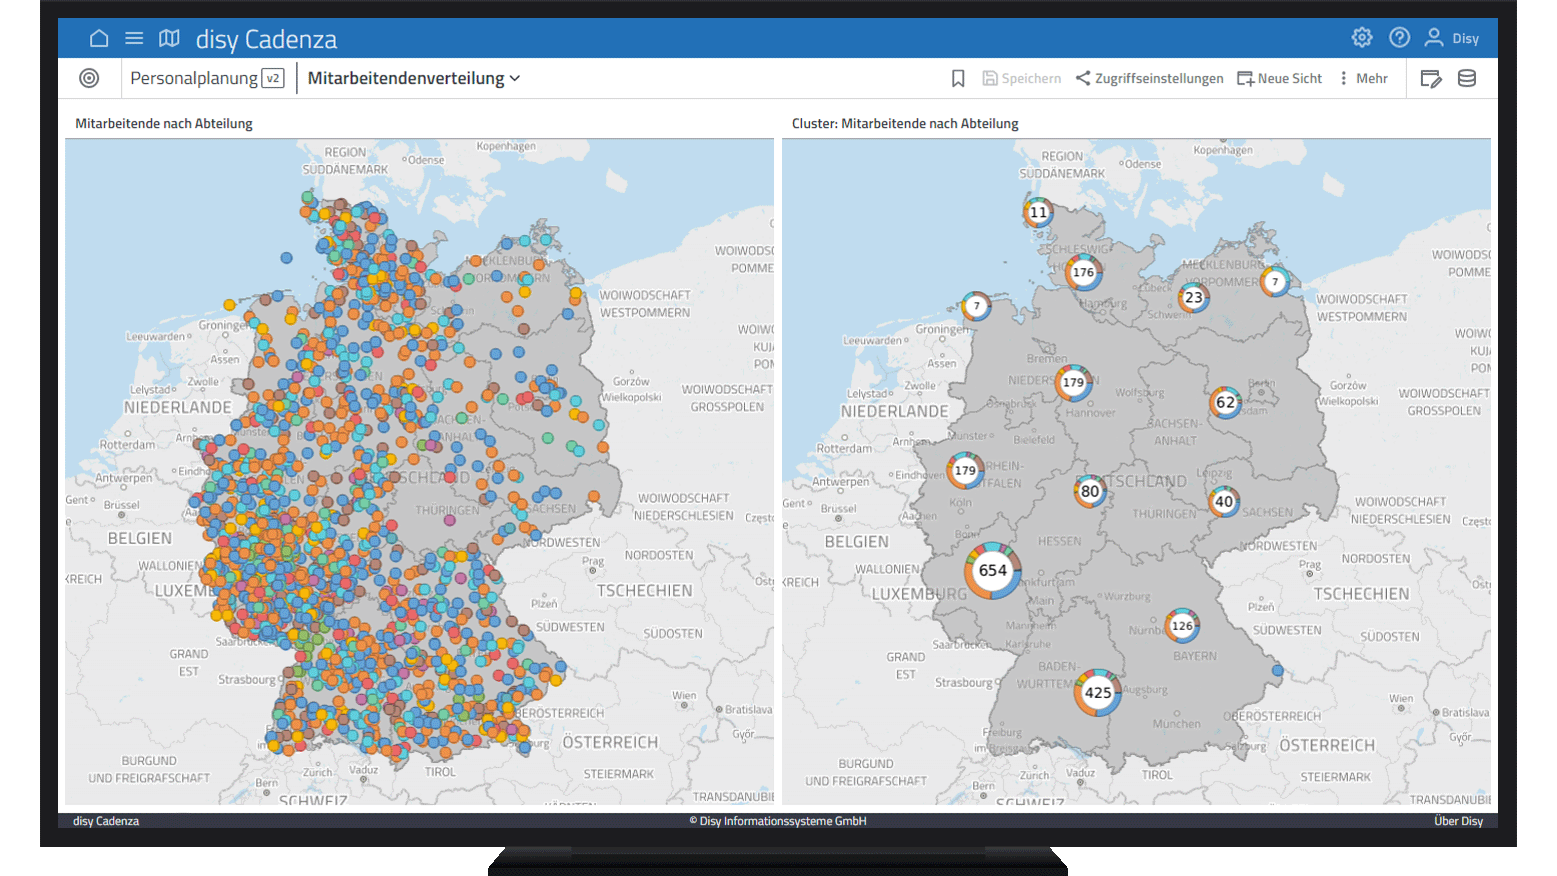
The geographic location of your data contains valuable information: See where relevant buildings, branches, routes, roads, catchment areas, estates, forests and much more are located. Clusters, patterns and dependencies of local conditions are revealed. With disy Cadenza, you can also create your own detailed expressive maps. Addresses, coordinates, routes, lines, points and polygons can be displayed flexibly and in a variety of ways to suit the use case.
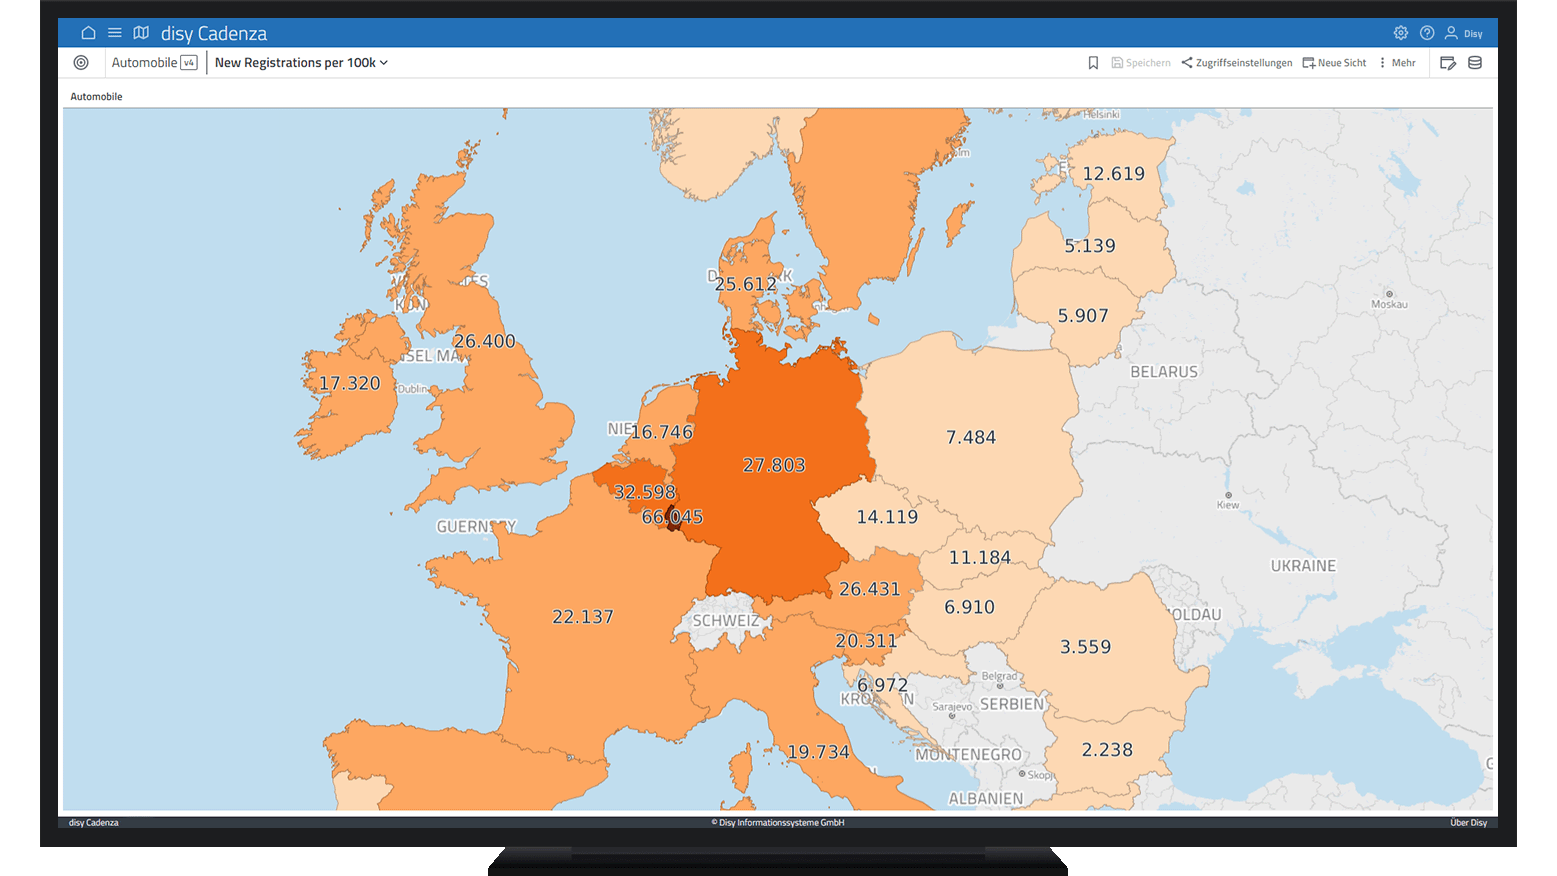
To see details, you can toggle different layers on and off as needed or use scale-dependent layer display for an even better overview.


Filters also allow you to spatially restrict the scope of your search in your data. For example, after selecting the data of a state, county or branch, your search results will be directly displayed on the map. Use the sketch layer according to your needs and highlight important areas, buildings and roads.
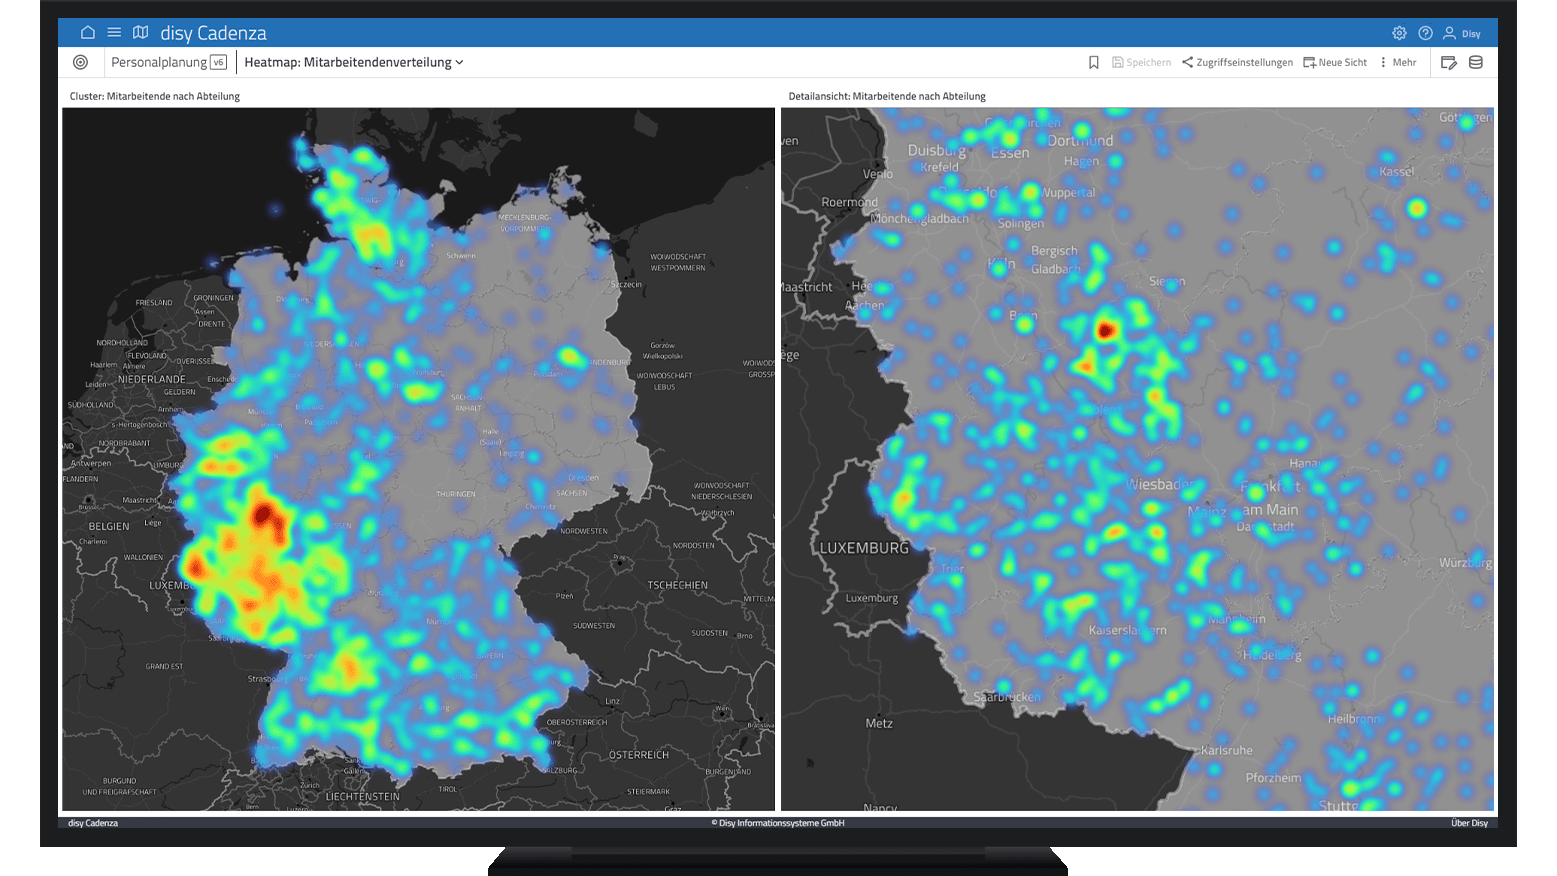
Among many other useful features, you can share this custom information on the map with your team, so everyone has the same level of information. Layers can also be displayed on a scale-dependent basis. For example, when zooming in on the map, you can switch from a heatmap to individual point data.
Enable Location: Unleash the Spatial Reference for Geo Analytics
When attribute data is related to spatial data, it takes on a whole new power and meaning: the correlation brings geographic properties into play, revealing new knowledge and insights. You can do this with the help of disy Cadenza's geocoding services and our "SDI in a Box" software and services package.
A whole new horizon unfolds with new analytical possibilities: Routing, reachability zones, finding points of interest, just to name a few.


Expanding Geo-Analytics: Integrate any Type of Data into Analyses
Go one step further and integrate additional spatial databases and geodata services into analyses alongside your data. Quickly and reliably add new data to your dashboards: Load geodata from files such as shapefiles or GPX files or connect directly to spatial databases such as Oracle Locator/Spatial or PostgreSQL/PostGIS. Use external services such as WMS, WFS or ArcGIS Server via the REST interface to display additional layers in the background or to flexibly enrich your data.
Integrating Movement: The Third Dimension of Analysis is Ready for You

When objects are not fixed in space but move, completely new questions arise, because spatial movements can provide relevant information about people, animals or moving objects. Events can also be analyzed spatially and temporally. Are storks fitted with transmitters always flying directly south or are some taking a detour? Where and why do they stop? Integrating and analyzing the movement of people, animals, objects or events over time and space can lead to profound insights. This does not necessarily be done retrospectively but can also be done live in the map.
Professional Capturing and Editing of Spatial Data
In disy Cadenza, geodata can also be captured manually; we enable you to efficiently digitize new custom data as well as edit existing geodata according to your specific requirements. Take advantage of our comprehensive editing functions and specialized land registries with predefined key lists and automatic plausibility checks – no matter whether your geodata is available as a shapefile in the file system, professionally managed in a spatial database such as Oracle Locator/Spatial, PostgreSQL/PostGIS or SQLite/SpatiaLite, or via geodata services such as WFS-T or ArcGIS Server with the ArcGIS REST API.
The spatial features of disy Cadenza are also available for embedding in your own custom applications and GIS apps. Your digital processes include a reliable map component that not only visualizes spatial objects, but also allows you to edit them. This saves you a lot of development time!
Geo Analytics unlocks a whole new level of information potential from your data: use maps and geographic information to get the most out of your data!
Contact us


Interested in disy Cadenza?
We would be happy to introduce you to disy Cadenza in a personal meeting.